Benchmark blend: How much should your client blend?
29 September 2021
It’s no secret that Just SA believes partial annuitisation in a blended living annuity is the optimal solution for South African retirees. Blending allows annuitants to structure a suitable combination of guaranteed and flexible income over time, balancing the various trade-offs by switching additional tranches into the life annuity component when required. This combination makes a living annuity more sustainable, mitigating the risk of running out of money too early.
While the concept of a blended annuity is generally understood, the question of how much to blend is still prevalent.
A blended annuity allows clients to ‘dial up’ the level of guaranteed income to find an optimal balance between a life annuity (Just Lifetime Income – JuLI), which pays an income for life no matter how long they live or what markets do, and a living annuity, which provides flexibility for discretionary spending or to leave a financial legacy.
Secure a guaranteed income to cover essential expenses
The Just Retirement Insights survey results from 2020 show that a whopping 91% of respondents believe that generating an income to cover regular bills is the most important job of their retirement savings. We refer to these ‘regular bills’ as essential expenses. Essential expenses cover the cost of physical survival – the basic cost of living – and include expenses like accommodation, food and clothing, utilities, medical, transport and insurance. Latest figures from Statistics SA indicate that a household’s essential expenditure makes up between 65% and 75% of total monthly budget across all socio-economic categories, with nominal fluctuations between income levels.
This is a good guideline, but the actual percentage will vary for each of your clients and will depend on their age, joint or single life policy, how much money they have saved, and their needs and wants in retirement. A client will need their own blend to suit their budget.
Calculating a benchmark blend
To help you tailor individual blends, Just SA created a framework for calculating how much to allocate to the life annuity component based on a client’s profile.
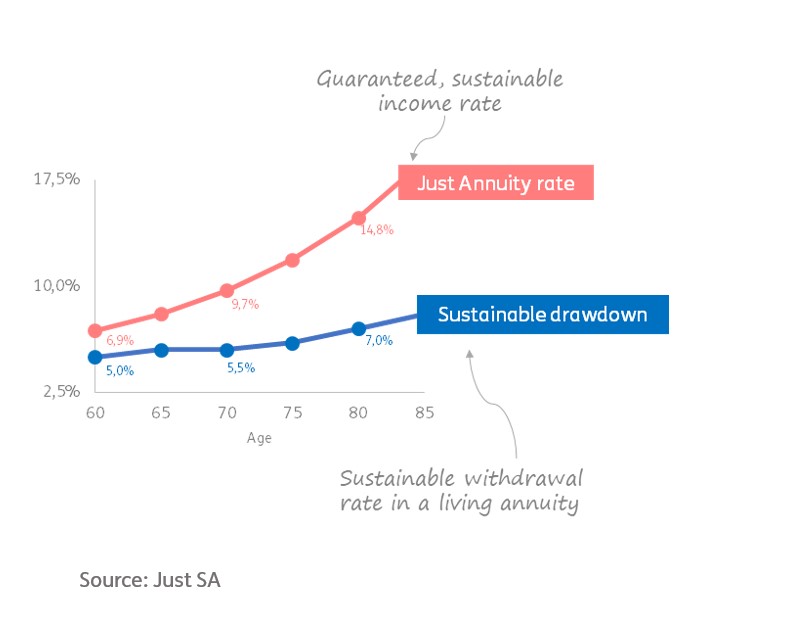
1. Consider the sustainable income percentage from a blended annuity
The sustainable income percentage from a blended annuity can be represented by two components: the life annuity (JuLI) rate and the FSCA’s draft recommended drawdown percentage in a living annuity, which provides a good estimate for a sustainable income from a living annuity. The combination of these represents a sustainable income percentage from a blended annuity.
2. Derive the benchmark blend percentage
A benchmark blend percentage is determined by comparing the combined sustainable income percentage to your client’s required annual drawdown percentage.
- Together with your client, ascertain how much they want to draw down from the living annuity.
- Compare that desired drawdown to the FSCA draft recommended drawdown percentage in a living annuity (see table in Appendix A). Gender, age, and whether it is a single or joint life policy are required to get the most accurate draft FSCA rate.
- What is the client’s JuLI annuity rate?
- If you’re an adviser registered with Just SA, you can obtain a client’s JuLI annuity rate via JustTools, which allows you to request quotes direct to your inbox.
- Alternatively, contact your relationship manager to assist.
- Map out the required drawdown percentage against your client’s age to see which zone or scenario they fall into.
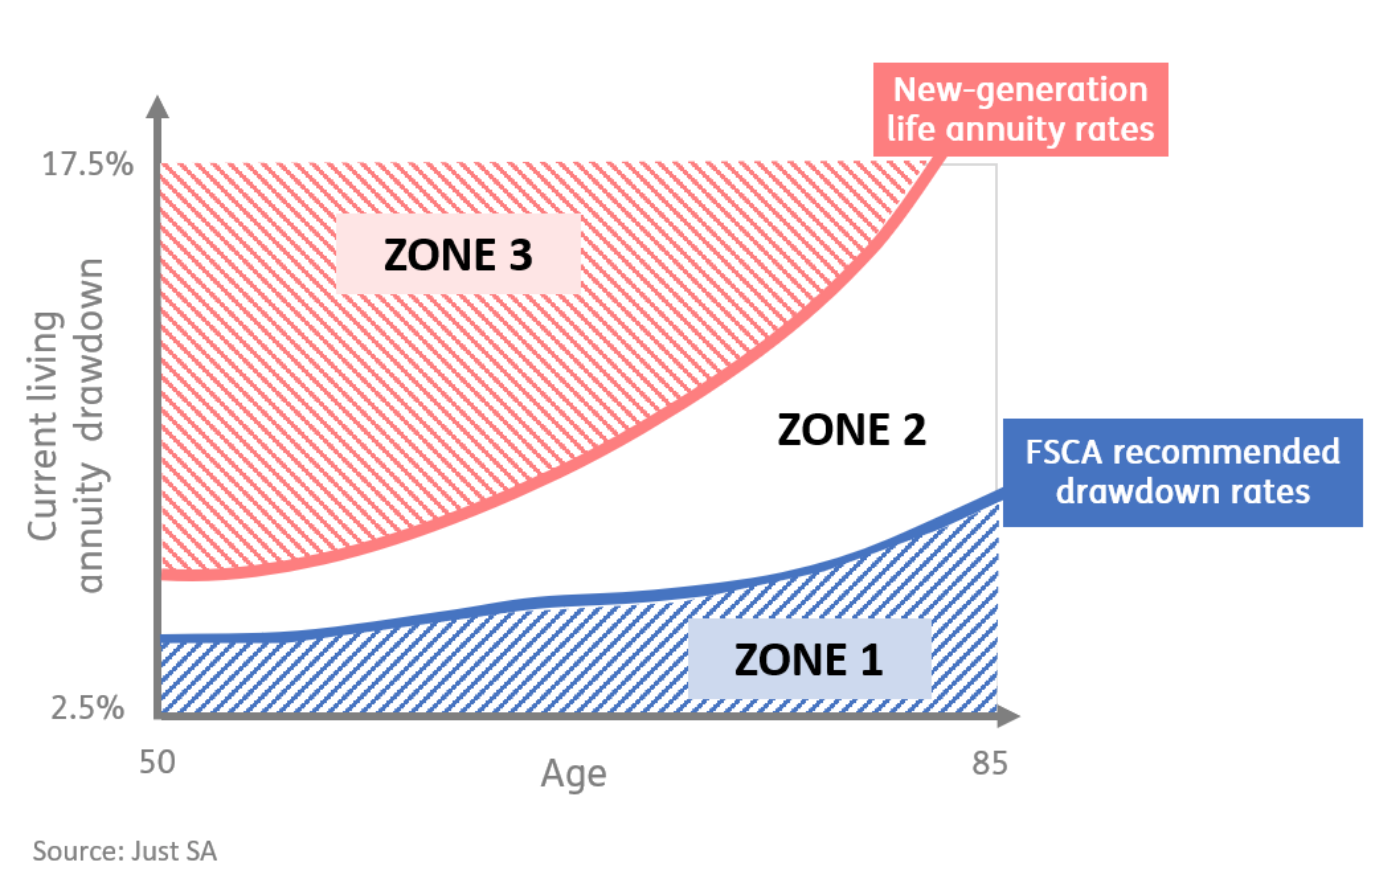
Zone 1
If the required drawdown is lower than the FSCA rate – and is therefore in the BLUE zone – the benchmark blend % is the minimum proposed (10%). Even those with very low drawdown rates can seek to improve their retirement outcome with a blended annuity as a diversifying asset class.
Zone 2
If the required drawdown is between the FSCA rate and the JuLI annuity rate – and is therefore in the WHITE zone – the benchmark blend % is derived by interpolation within the range of the two points. Retirees in Zone 2 are likely to benefit most from a switch to a blended annuity.
Zone 3
If your client’s required drawdown is higher than the JuLI annuity rate – and is therefore in the CORAL zone – the benchmark blend % is the maximum proposed (75%) to protect against longevity and market risk. Retirees with high, unsustainable drawdown rates (Zone 3) risk running out of money.
Practical application
The framework provides a way to derive the benchmark blend for an individual. For this calculation, we also allow for the gender of the main life and whether the life is single or joint, given that these two determinants are factored into the JuLI and FSCA rates.
A client’s specific benchmark blend can be seen either as part of an Income Sustainability Map (previously referred to as a scatterplot) for their portfolio or, depending on your arrangement, in JustBlend on the outcome screen.
A reminder that blending a life and living annuity need not be an all or nothing decision. Blending allows you and your client to structure an optimal portfolio over time. The benchmark blend is a guideline to help you calculate an appropriate amount to be allocated to the life annuity component depending on your client’s needs and circumstances.
Download a PDF version of the September 2021 Newsnote
Need more information?
Please let us know if you would like to discuss the above in more detail, or to request a quote:
Email: sales@justsa.co.za
Call: 087 238 2690
A reminder that JustTools allows registered users to request quotes direct to your inbox. If you are not registered, please email info@justsa.co.za and we will gladly assist you.
Appendix A
|
Sustainable income |
Sustainable income |
| Male | Female | Male | Female | |
| Age 55 | 5.5% | 4.5% | 4.5% | 4.0% |
| Age 60 | 6.5% | 5.0% | 5.0% | 4.5% |
| Age 65 | 7.5% | 6.0% | 5.5% | 5.0% |
| Age 70 | 9.5% | 7.5% | 5.5% | 5.0% |
| Age 75 | 12.0% | 9.5% | 6.0% | 5.5% |
| Age 80 | 15.0% | 12.5% | 7.0% | 6.0% |
| Age 85 | 20.0% | 16.5% | 8.0% | 7.0% |
|
Source(s): JuLI HiGro annuity rates: guaranteed income, increases in line with inflation when Balanced Portfolio delivers CPI + 4% p.a. after fees; Draft Criteria for Living Annuities in a Default Annuity Strategy (FSCA, 2018) on sustainable drawdowns for Living Annuities (ASISA working group model)
Assumptions: 11-12% p.a. equity, 8-9% p.a. fixed interest, 5-6% p.a. cash, 5-6% p.a. inflation, industry mortality tables |