Living annuities: Helping your clients understand the impact of different drawdown rates

A new white paper on living annuities and the impact of drawdown rates, based on a study of 20 000 anonymous living annuitants, has been published by retirement income specialist Just SA.
Some of the key findings are:
- 32% of annuitants are drawing down at, or less than, safe drawdown rates. This means 68% are drawing more than they can realistically sustain.
- The average drawdown rate is 8.5%.
- Considering the respective ages and sexes of this group, the average safe drawdown rate should be 5.3% per annum.
This means that on average, the income shortfall will be more than 15 years. This is a big challenge for advisers, who need to be armed with solid facts to help guide their clients towards a sustainable retirement income.
What a difference 0.5% can make
The Association for Savings and Investment South Africa's Standard on Living Annuities has largely been used as a guide for calculating clients’ sustainable drawdown rates. While this is an excellent place to start, it only shows drawdown levels in increments of 2.5%.
As an example, the difference between a 5.0% drawdown and a 7.5% drawdown may appear to be 2.5% but is actually 50%. It is the difference between drawing R50,000 a year from R1 million and drawing R75,000 from R1 million a year, which is an additional 20 years until a client’s income is expected to start reducing.
Working with increments of 0.5% better demonstrates the devastating effect that even a small increase in drawdown percentage has on a client’s income over the long term. And on the flip side, the positive effect of decreasing their drawdown rate by only 0.5%.
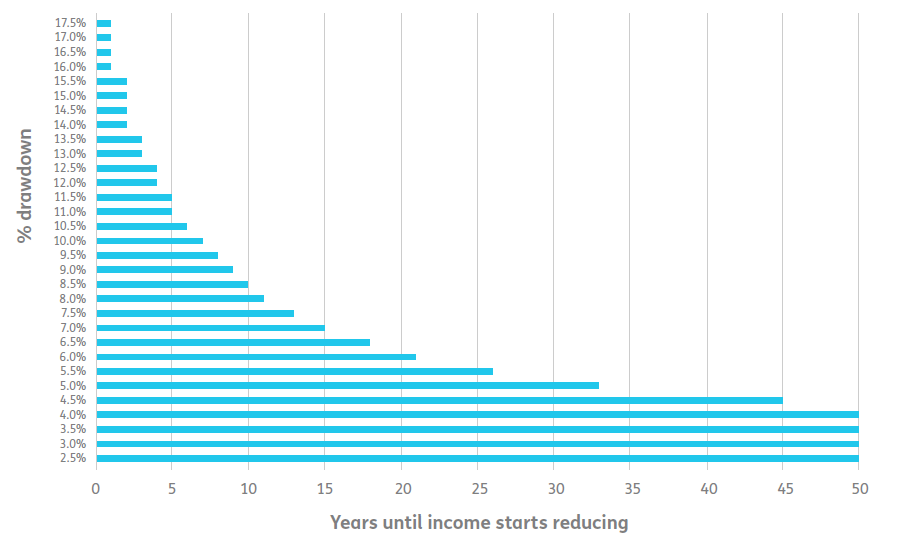
Fig 1: The difference in income longevity for drawdown increments of 0.5%

Note: Assumes 10% nominal returns.
The results show that drawing down 5% a year results in income reducing after 33 years; while drawing down 4.5%, just 0.5% less, results in income reducing after 45 years – a significant difference.
The next step is to factor in life expectancy. While using average life expectancy is fine for life annuities, it is too risky for living annuities. Using standard industry mortality assumptions, it may be surprising that:
- At age 75, 75% of the male population is expected to be alive.
- At age 82, 50% of the male population is expected to be alive.
- At age 89, 25% of the male population is expected to be alive.
- At age 95, 10% of the male population is expected to be alive.
For females, the picture is similar but slightly elongated because their mortality rates are lower.
Planning for average life expectancies isn’t enough
This brings us to a crucial point: financial planning should cater to age 95 for males and age 100 for females. A client’s financial plan cannot only cover the years up to average life expectancy. That would be the same as planning for only half the population. Put differently, there's a 50% chance that a person will live longer than their life expectancy, and advisers should plan accordingly.
As an example, looking at the probabilities of survival for a male aged 65 against the expanded ASISA table (years until income will start to reduce) gives us the following results:
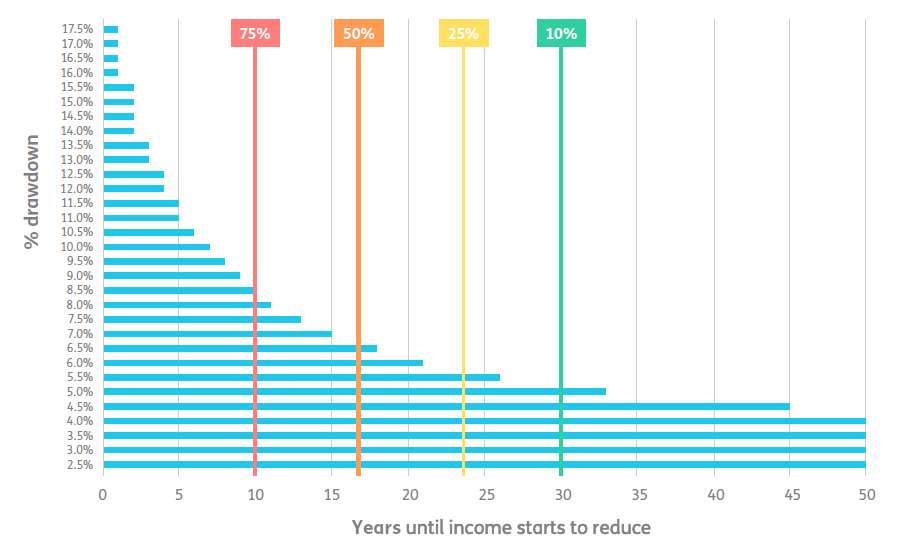
Fig 2: Drawdown levels in increments of 0.5% versus survival probability for a male aged 65

Note: Assumes 10% nominal returns.
With a drawdown rate of 5%, the number of years until income reduces is more than 30. This means that we would expect income to reduce for less than 10% of annuitants whilst they are still alive.
On the other hand, if we look at a drawdown of 8.5% and higher, the number of years until income reduces is at or below 10. This means we would expect that for more than 75% of lives (males aged 65) income will start to reduce while they are still alive.
In an age of uncertainty, retirees understandably seek certainty. No matter how much planning goes into it, when faced with the decision to convert hard-earned retirement funds into a reliable income in retirement, many are still unsure if it will be enough to last and rely heavily on their financial advisers to help them. Demonstrating that a 0.5% difference in drawdown alone can have a material impact on income sustainability will go a long way towards helping retirees.
To download Just SA’s Optimal Retirement Income Strategies white paper, click here.
